
Big data, a term used to describe large and complex data sets, has become a significant part of our digital world. With the continuous expansion of mobile data, cloud computing, machine learning, and IoT, the big data industry is experiencing tremendous growth
The realm of the Big Data industry encompasses various aspects, including data centers, cloud services, IoT devices, and predictive analysis tools. However, what does the industry reveal when examined through raw numerical insights? This is precisely what we aim to explore in this comprehensive roundup of Big Data statistics.
Allow us to guide you through compelling and thorough Big Data statistics that offer valuable insights.
Contents:
- Top Big Data Statistics 2024
- How Big is Big Data?
- Global Market Size of the Big Data Industry
- Rise in Data Generation
- Adoption Of Big Data By Businesses
- AI and ML Integration in Big Data
Top Big Data Statistics 2024:
- The Big Data market volume is expected to reach $84 billion in 2024.
- Around 2.5 quintillion bytes worth of data are generated each day
- The big data analytics market is predicted to reach $349.56 billion in 2024.
- The volume of data created worldwide as of 2023 is 120 zettabytes and is expected to reach 181 zettabytes by the end of 2025.
- Over 57% of the data worldwide is generated by internet users worldwide. 70% of the world’s data is user-generated
- In 2024, the number of IoT devices worldwide will reach 17.08 billion.
- Big Data analytics for the healthcare industry could reach $79.23 billion by 2028
- Cloud computing end-user spending totals around $500 billion annually
- 95% of businesses said that managing unstructured data is a significant problem.
- More than 91% of organizations are investing in artificial intelligence and big data today.
- 31% growth in demand for composite data analytics professionals is expected by 2030.
- 96% of companies plan to hire job seekers with big data skills. (Source)
- With the help of big data, Netflix saves over $1 billion annually with customer retention.
- 45% of businesses are running at least one Big Data workload on the enterprise cloud
- 60% increase in operating margins can be achieved by retailers that use big data.
- 14% is the approximate year-on-year growth is observed in the big data market every year.
- 28% increase in data science jobs is expected to be seen by 2026.
- Data interactions went up by 5000% between 2010 and 2020
- 72% of manufacturing executives rely on advanced data analytics to improve productivity.
How Big is Big Data?
Big Data refers to the large, diverse sets of information that grow at ever-increasing rates. It encompasses the volume of information, the velocity or speed at which it is created and collected, and the variety or scope of the data points being covered1. The term is often associated with three key concepts: volume, variety, and velocity.
As of 2020, the digital universe was estimated to consist of a whopping 44 zettabytes of data. To put that into perspective, one zettabyte is roughly equal to a trillion gigabytes3. The size and number of available data sets have grown rapidly as data is collected by devices such as mobile devices, cheap and numerous information-sensing Internet of things devices, aerial (remote sensing), software logs, cameras, microphones, radio-frequency identification (RFID) readers, and wireless sensor networks. The global data volume was predicted to grow exponentially from 4.4 zettabytes to 44 zettabytes between 2013 and 20202. This highlights the immense scale of Big Data and its continuous growth in the digital age.
Volume of data/information created, captured, copied, and consumed worldwide from 2010 to 2020, with forecasts from 2021 to 2025(in zettabytes)
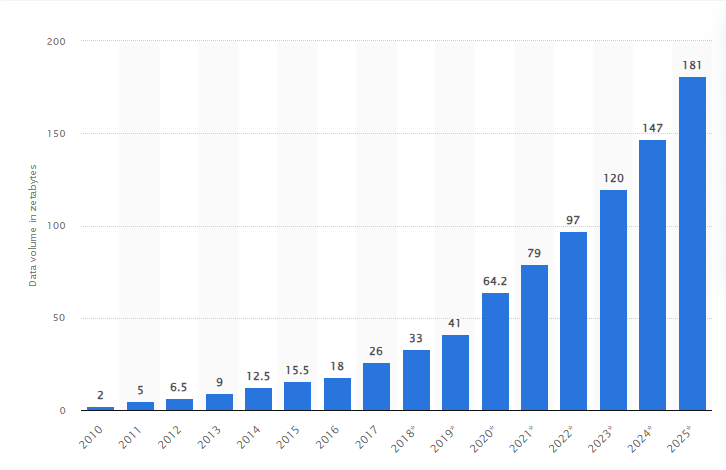
Source: Statista.com
20. Big Data was referred to one gigabyte or 1 GB in 1999. (Source)
Today, the term symbolizes peta bytes (1024 terabytes), exabytes (1024 petabytes) or zettabytes (1024 exabytes). This may include billions or trillions of records from billions of people worldwide.
21. By the end of 2025, internet traffic is expected to generate 150 to 200 zettabytes.
According to Cisco, the annual internet traffic has already crossed the benchmark of one Zettabyte.
22. To download all the data on the internet, an internet user will need approximately 180 million years. This number shows the immense amount of data available on the internet.
Here is a sneak peek of all the Big Data User Statistics
- Google Gets More than 9 Billion Searches per Day
- WhatsApp Users Exchange Over 100 Billion Messages Daily
- Every Person-Generated 1.7 Mb of Data per Second in 2020 Alone
- Over 95 Percent of Businesses Think that Managing Unstructured Data Is Their Primary Problem
- 45% of Global Businesses Are Operating a Significant Data Workload On Cloud
- Over 80 Percent of Data Generated Today Is Unstructured
- More than 231 million emails are sent.
- Around 500 hours of videos are uploaded on YouTube.
- Instagram users share around 66,000 photos.
- 1.7 million content pieces are shared on Facebook.
- More than 4.3 million Snaps are sent on Snapchat.
- 16 million text messages are sent.
- More than $443,000 is spent by consumers on Amazon.
- Around 347,200 tweets are tweeted on Twitter.
- Over 120 professionals join LinkedIn.
Global Market Size of the Big Data Industry
23. The Big Data market size is expected to be $77 billion by the end of 2023. It is forecasted to reach $103 billion by the end of 2027.
Big data market size revenue forecast worldwide from 2011 to 2027(in billion U.S. dollars)
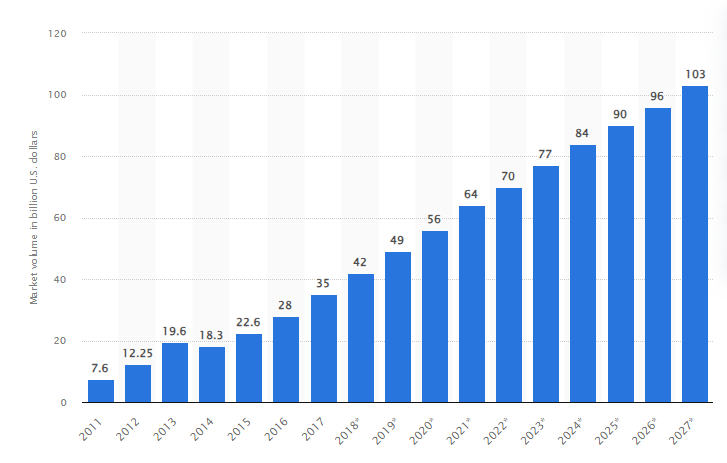
Source: Statista.
Interesting Facts About Big Data
24. Over 57% of the world’s data is produced by internet users, contributing to a staggering 900 exabytes of information on the web. This user-generated data is ubiquitous, found across various platforms such as social media, email exchanges, consumer reviews, and beyond.
25. Google registers over 6 million searches per minute, translating to a remarkable 100,000 searches conducted every second by online users.
26. A significant 72% of adults in the United States express concerns about companies exerting excessive control over their data. Given the vast number of individuals storing their data online, there is a prevailing belief that this information is at risk and could potentially be exposed to unauthorized sources.
27. Almost 90% of the data stored today is unstructured.
Most companies admit that the data they have stored is unstructured. This unstructured data includes images, audio, videos, sensors, and text data.
Big Data Growth over the Years
28. The volume of data created worldwide in 2024 is expected to reach 147 zettabytes.
This data created is expected to reach 181 zettabytes by the end of 2025. Comparatively, in 2013, the volume of data created was recorded to be nine zettabytes.
The following table displays the volume of data created over the years:
| Year | Data Volume |
| 2025* | 181 zettabytes |
| 2024* | 147 zettabytes |
| 2023 | 120 zettabytes |
| 2022 | 97 zettabytes |
| 2021 | 79 zettabytes |
| 2020 | 64.2 zettabytes |
| 2019 | 41 zettabytes |
| 2018 | 33 zettabytes |
| 2017 | 26 zettabytes |
| 2016 | 18 zettabytes |
| 2015 | 15.5 zettabytes |
| 2014 | 12.5 zettabytes |
| 2013 | 9 zettabytes |
29. The global Big Data market is expected to grow by 9% in 2024.
The year-over-year growth of the big data market has declined over the past years, considering most of the data was fed on the internet between 2016 and 2018.
The following table displays the percentage of year-over-year growth of the big data market over the years:
| Year | Growth of Big Data |
| 2027* | 7% |
| 2026* | 7% |
| 2025* | 7% |
| 2024* | 9% |
| 2023 | 10% |
| 2022 | 9% |
| 2021 | 14% |
| 2020 | 14% |
| 2019 | 17% |
| 2018 | 20% |
| 2017 | 24% |
| 2016 | 22% |
| 2015 | -16% |
Source: Statista.
Rise in Data Generation
An astounding 2.5 quintillion bytes (LinkedIn) of data is projected to be generated every day in 2024. This surge is driven by the proliferation of connected devices, IoT technologies, and the digital transformation initiatives embraced by organizations worldwide.
How much data is created every day?
30. Around 328.77 million terabytes of data is created every day.
This equals 0.33 zettabytes every day and 2.31 zettabytes per week.
The following table displays the breakdown of the data created over time.
| Time | Amount of data created |
| Every day | 0.33 zettabytes |
| Every week | 2.31 zettabytes |
| Every Month | 10 zettabytes |
| Every Year | 120 zettabytes |
Adoption Of Big Data By Businesses
31. As of 2023, 39.5% of businesses have adopted big data for managing datasets as a business asset.
On the other hand, 59.5% of the organizations said that they had adopted big data technology to drive innovation with the help of data.
At the same time, 23.9% of the organizations have used big data to create data drive organizations.
The following table displays the reasons for various organizations adopting Big data.
| Reasons for Adopting Big Data | 2023 | 2022 | 2021 | 2020 | 2019 |
| Managing data as a business asset | 39.5% | 39.7% | 39.3% | 50% | 46.9% |
| Established a data culture | 20.6% | 19.3% | 24.4% | 26.8% | 28.3% |
| Driving innovation with data | 59.5% | 56.5% | 48.5% | 64.2% | 59.5% |
| Competing on data and analytics | 40.8% | 47.4% | 41.2% | 45.1% | 47.6% |
| Created a data-driven organization | 23.9% | 26.5% | 24% | 37.8% | 31% |
Source: Statista.
32. 40% of big data users have adopted big data analytics.
33. According to Forbes, around 87.8% of the companies have increased their investment in data.
34. 27% of the business executives said their investments in Big Data initiatives have resulted in huge profits.
At the same time, 45% of the companies said it was a break-even, and they could not profit much. On the other hand, the rest, 12% of the people, said that their businesses made a loss after investing in big data initiatives.
35. 50% of the executives in the United States reported that the biggest they face while investing in big data technologies are budget constraints.
At the same time, 39% of the European executives had the same view and considered it one of the top challenges while investing in big data technologies.
36. The United States is the home to 2,701 data centers alone.
The number of big data centers in the United States is double compared to those in the United Kingdom, Germany, and China combined.
These data centers store and transmit data worldwide and are vital for cloud management, colocation, and managing data services.
The following table displays the number of Data centers Worldwide.
| Country | Number of data centers |
| United States | 2,701 |
| Germany | 487 |
| UK | 456 |
| China | 443 |
| Canada | 328 |
| Australia | 287 |
| Netherlands | 281 |
| France | 264 |
| Japan | 207 |
| Russia | 172 |
| Mexico | 153 |
Source: Statista.
37. 82% of organizations worldwide are looking forward to increasing their investments in data modernization.
This number increased from 41% in 2022 after the increase in the industry’s significance of big data and data modernization.
38. 19% of the executives reported that they had established a data culture in their company.
Big Data Analytics Tools
Big data analytics tools are solutions that pull data from multiple sources and prepare it for visualization and analysis to discover deeper business insights into trends, patterns and associations within data. Big Data Analytics is a process that enables data scientists to make something out of the stack of big data generated. This analysis of big data is done using some tools that we reckon as big data analytics tools.
Read more on Top 50 Big Data Analytics Tools and Software You should know in 2024
Top Big Data Analytics Companies :
The Big Data sector itself is a prime example of rapid transformation. Big Data startups are competing for market share with the blue-chip giants that have dominated the business intelligence software market. The top Data Analytics companies to take into account are listed below. Let’s check some of the leading big data companies in the world Top 30 Big Data Companies to watch in 2024
How is big data utilized in various Industries?
39. 46% of organizations worldwide reported using big data analytics in market research.
Big data plays a significant role in market research. With trillions of online data sets that provide details about consumer preferences, market research has become quite easy. Organizations can scrape the data they need easily with the help of tools available.
The following table displays the percentage of organizations worldwide using big data analytics in market research over the years.
| Year | Percentage of organizations |
| 2021 | 46% |
| 2020 | 45% |
| 2019 | 39% |
| 2018 | 41% |
| 2017 | 35% |
| 2016 | 35% |
| 2015 | 32% |
| 2014 | 31% |
Source: Statista.
40. 56% of healthcare centers have adopted the use of predictive analysis worldwide.
This number has increased over the years to provide better healthcare facilities to patients and ensure they receive proper treatments.
The healthcare industry rapidly adopts the technology in Singapore, with a 92% adoption rate.
The following table displays the adoption rate of predictive analysis technology in the healthcare industry of the selected countries.
| Country | Rate of adoption |
| Singapore | 92% |
| China | 79% |
| Brazil | 66% |
| United States | 66% |
| Indonesia | 65% |
| Italy | 65% |
| France | 64% |
| India | 59% |
| Netherlands | 59% |
| Global average | 56% |
| Australia | 55% |
| Germany | 54% |
Source: Statista.
41. 43% of IT managers believe that IT infrastructure won’t be enough to handle future data demands.
The demand for cloud storage has increased in recent years. Looking at the rapid increase of the data created, the IT decision-makers believe that the infrastructure available today won’t be able to store it all.
42. 68% of travel brands reported looking forward to investing in predictive analytics or business intelligence in the upcoming years.
After a detailed look at the advantages of Big data, many travel companies have shifted towards investing in the industry. They look forward to improving the consumer experience, reputation, and pricing strategies with the help of big data.
43. Google Analytics has the largest share of the web analytics industry.
Google dominates the web analytics market, with more than 70% of the market share belonging to its tools.
Here is a detailed breakdown of the market share of leading web analytics technologies worldwide:
| Web Analytics tool | Market share |
| Google Analytics | 29.62% |
| Google Global Site Tag | 23.73% |
| Google Universal Analytics | 19.61% |
| Facebook Analytics | 5.86% |
| MonsterInsights | 3.85% |
| Other | 17.33% |
Source: Statista.
44. 98% of the social media analytics and monitoring software market share belonged to linkfluence.
Social media analytics and monitoring software are used to optimize the extracted social media insights.
Here is a table displaying the market share breakdown of the leading social media analytics and monitoring software.
| Social media analytics and monitoring software | Market Share |
| Linkfluence | 98.05% |
| Meltwater | 0.69% |
| Netvibes | 0.45% |
| GetSocial | 0.23% |
| Brandwatch | 0.13% |
| Others | 0.45% |
45. Mode was the leading software in the global business intelligence software market, with a market share of 26%.
The business intelligence software provides the companies with access to analyze the information and improve the decisions and performance of the company.
The following table displays the market share owned by the leading players of the Business intelligence market.
| Business Intelligence software | Market share |
| Mode | 26.16% |
| Tableau | 12.52% |
| Power BI | 7.17% |
| Microsoft SQL Server Reporting | 5.55% |
| SAP Crystal Reports | 5.1% |
| Other | 43.5% |
Big Data Analytics
46. The Big data analytics revenue is expected to reach $68.09 billion by the end of 2025.
The revenue generated by the Big Data Analytics market in 2019 was $14.85 billion.
47. The size of the big data analytics market worldwide is worth $308.26 billion and is predicted to reach $349.56 billion in 2024.
At the same time, it is expected to reach $655.53 billion by the end of 2029.
This is due to the rapid increase observed in the data, which parallelly affects the data analytics market size increase.
Here is a table that depicts the predicted size of the Big data analytics market over the next few years:
| Year | The market size of the big data analytics market |
| 2023 | 308.26 billion |
| 2024* | 349.56 billion |
| 2025* | 396.4 billion |
| 2026* | 449.52 billion |
| 2027* | 509.76 billion |
| 2028* | 578.06 billion |
| 2029* | 655.53 billion |
Source: Statista.
48. In 2022, Big data and business analytics generated a revenue of $274.3 billion.
Comparatively, in 2021, they were able to generate $ 215.7 billion. However, more than half of this spending went towards the services. Around $85 billion went to IT services, and the rest to business services.
Here are the details about the revenue big data and business analytics generated over the years.
| Year | Revenue generated by Big data and business analytics |
| 2022 | 274.3 billion |
| 2021 | 215.7 billion |
| 2019 | 189.1 billion |
| 2018 | 168.8 billion |
| 2017 | 149 billion |
| 2016 | 130.1 billion |
| 2015 | 122 billion |
Source: Statista.
49. 51% of the big data and analytics market share is owned by the United States.
The United States spends the most on big data and analytics, creating a huge gap between its spending and the spending done by other regions around the world.
In 2021, the United States spent almost $110 billion, while China and Japan spent $11.9 billion and $12.4 billion, respectively.
50. The market value of global Analytics as a service (AaaS) is expected to reach almost $69 billion by the end of 2028.
This prediction is based on the year-over-year increase recorded over the past years.
The following table displays the AaaS market size forecast.
| Year | Market size of SaaS |
| 2028* | 68.9 billion |
| 2027* | 58.71 billion |
| 2022 | 18.9 billion |
| 2021 | 15.17 billion |
Source: Statista.
51. MATLAB had the highest share of the global advanced analytics and data science industry.
It grabbed a market share of 13.5% in the industry and was followed by HubSpot Analytics and Alteryx, with a market share of 9.21% and 9.92%.
The following table displays the percentage of market share grabbed by the leading advanced analytics and data science technologies across the globe.
| Leading technologies | Percentage of market share |
| MATLAB | 13.5% |
| Alteryx | 9.92% |
| HubSpot Analytics | 9.21% |
| Qlik (QlikTech) | 5.57% |
| Stata | 4.29% |
| Other | 57.51% |
Big Data Technologies and Facts
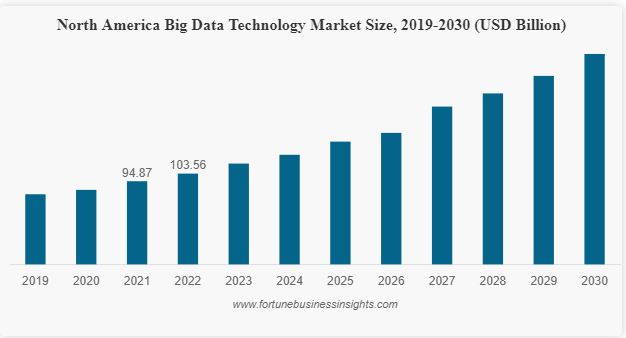
The global big data technology market size is projected to grow from $345.52 billion in 2023 to $842.17 billion by 2030, at a CAGR of 13.6% during the forecast period.
52. The number of IoT devices connected worldwide is forecasted to reach 17.08 billion in 2024.
Due to the rapidly increasing number of devices, this number is expected to reach 29.42 billion by the end of 2030.
The increased use of technology and the fast-paced increase of the Digitalization era has increased the number of devices worldwide.
The following table displays the number of IoT-connected devices worldwide recorded over the years and the forecast for the upcoming years.
| Year | Number of IoT devices connected worldwide |
| 2030* | 29.42 billion |
| 2029* | 27.31 billion |
| 2028* | 25.21 billion |
| 2027* | 23.14 billion |
| 2026* | 21.09 billion |
| 2025* | 19.08 billion |
| 2024* | 17.08 billion |
| 2023 | 15.14 billion |
| 2022 | 13.14 billion |
| 2021 | 11.28 billion |
| 2020 | 9.76 billion |
| 2019 | 8.6 billion |
Source: Statista.
53. The edge computing market worldwide is expected to reach $274 billion by 2025.
The edge computing market has increased due to the increase in the creation and storage of data.
The following table displays the edge computing market revenue worldwide.
| Year | Market Revenue |
| 2025* | 274 billion |
| 2021 | 176 billion |
| 2020 | 153 billion |
| 2019 | 139 billion |
AI and ML Integration in Big Data
The integration of Artificial Intelligence (AI) and Machine Learning (ML) in Big Data has become a transformative force in the field of data analytics. This abstract explores the symbiotic relationship between AI, ML, and Big Data, elucidating how these technologies collectively enhance data processing, interpretation, and decision-making. As organizations grapple with ever-expanding datasets, AI and ML algorithms offer unprecedented opportunities for advanced pattern recognition, predictive modeling, and automation.
This integration not only facilitates more accurate and timely insights but also empowers businesses to derive actionable intelligence from complex and voluminous datasets. Through a comprehensive examination of AI and ML integration in the Big Data landscape, this abstract aims to illuminate the profound impact these technologies have on data-driven decision-making and innovation in various sectors.
Today’s leading Top AI companies in the world are expanding their technological reach through other technology categories and operations, ranging from predictive analytics to business intelligence to data warehouse tools to deep learning, alleviating several industrial and personal pain points. There are several areas where artificial intelligence trends will have a tremendous impact in the year 2023
Read more at Top 100+ AI Companies
In 2024, as new updates and improvements take over the field of AI, the ranking of these AI platforms will have to shift. We look at the 20 best artificial intelligence platforms for 2024, and why we think they deserve to be on the list.
Read more at Top 20 Artificial Intelligence Platforms for 2024
Although machine learning is one part of the greater AI market, it is the most commonly implemented form of AI and growing rapidly in business. The global machine learning (ML) market is expected to grow from $21.17 billion in 2022 to $209.91 billion by 2029, at a CAGR of 38.8% in forecast period.
Read more at Top Machine Learning Trends to watch in 2024
The Impact of AI-Powered Predictive Analytics on Marketing Strategies in the Era of Big Data
How AI & Big Data is Changing Drug Discovery
Can Big Data and AI Finally Improve Mobile App Safety?
How can big data analytics and AI help streamline manufacturing workflows
Wrap Up
The continuous expansion of the Big Data industry hinges on the persistent generation of data by individuals. Ongoing advancements in data processing and analytics are poised to provide companies with enhanced capabilities to cater to their customers effectively and increase revenue.
Amidst the fervor of companies adopting new Big Data technology, there is a crucial need to ensure cost-effective implementation. Simultaneously, these companies must navigate the challenge of rebuilding trust among a public wearied by data breaches and privacy scandals. Striking a balance between technological innovation and rebuilding trust becomes imperative for sustained industry growth.
Sources:
- Statista
- Forbes
- G2
- Exploding topics
- Ernst & Young
- IDC
- Fortune Business Insights
- Allied Market Research
- Bureau of Labor Statistics
- SiliconANGLE
- Wikibon
- PWC
- Capgemini
- Inside Big Data
- Gartner
The post 50+ Incredible Big Data Statistics for 2024: Facts, Market Size & Industry Growth appeared first on Big Data Analytics News.


